
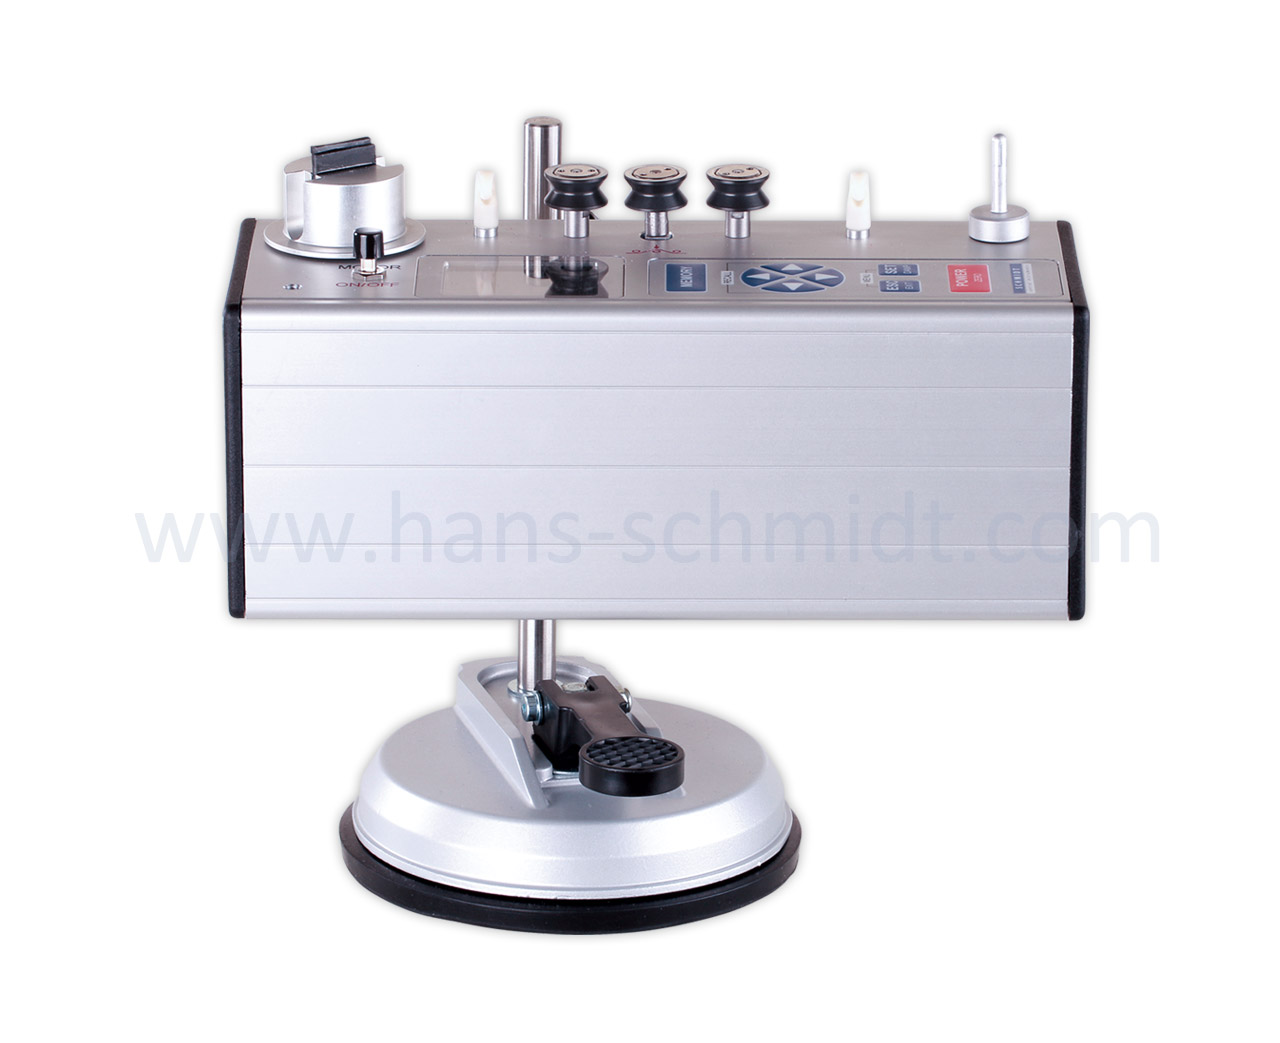


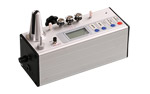
Electronic yarn tension meter MST with motorized take up with tension range up fixture
The electronic tension meter ETX is the basis of this instrument
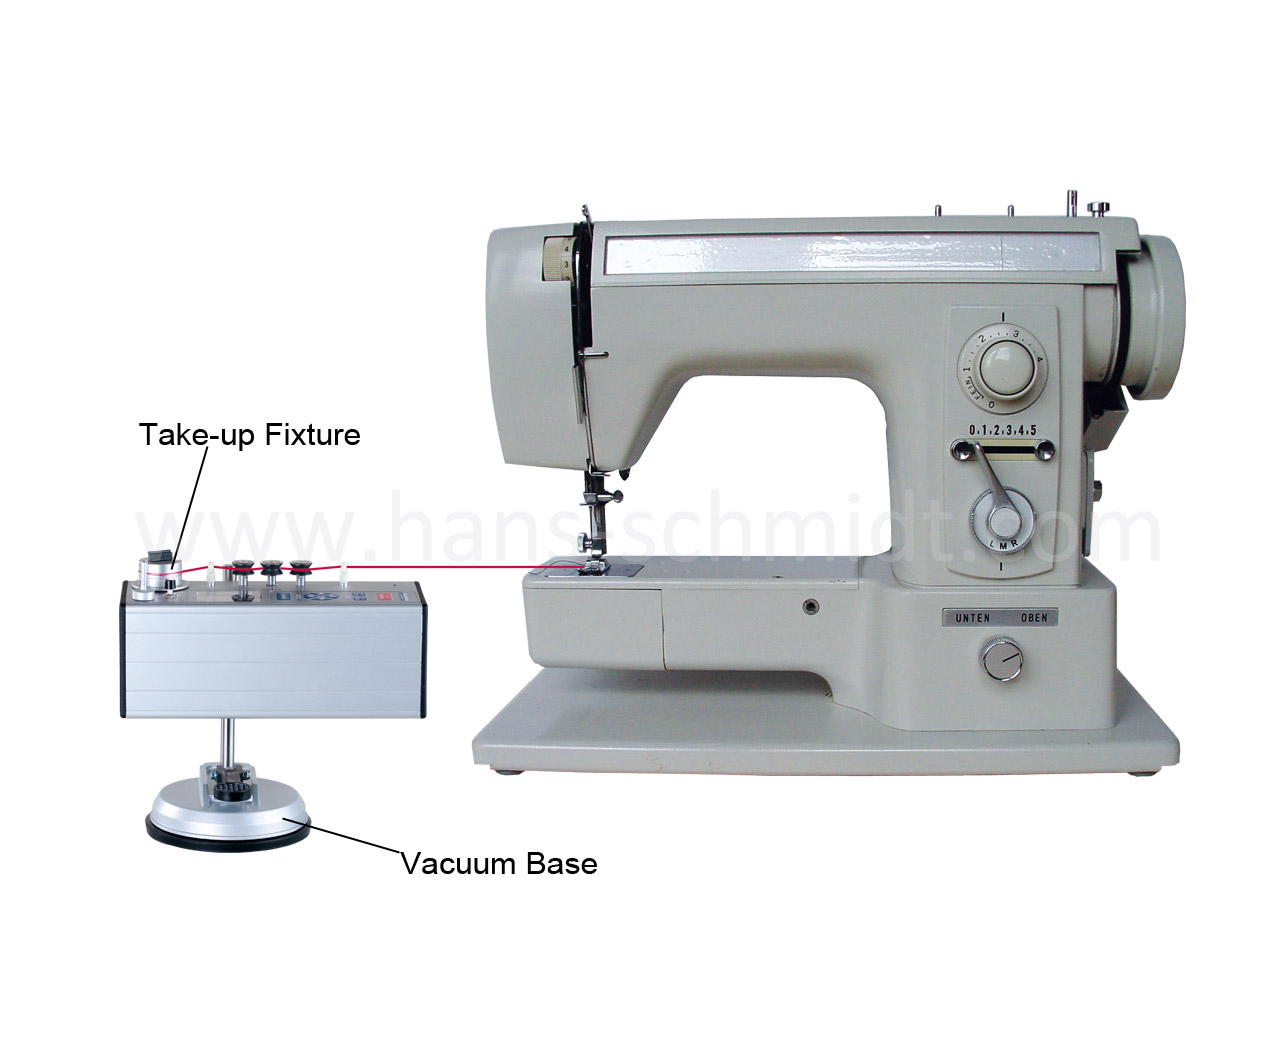
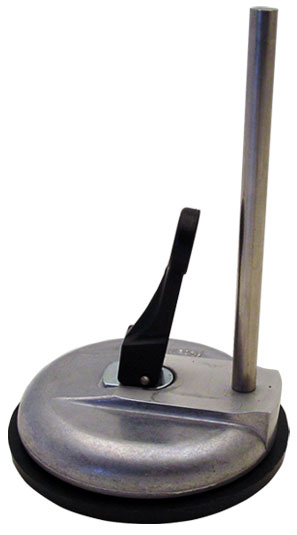
Motorized take-up fixture to have constant speed of the thread 9 m/min
Adjustable electronic damping for better reading when tension is constantly fluctuating
Vacuum base for positioning the unit on the work plate when tension is measured at the sewing machine
Special fixture to determine shuttle tension
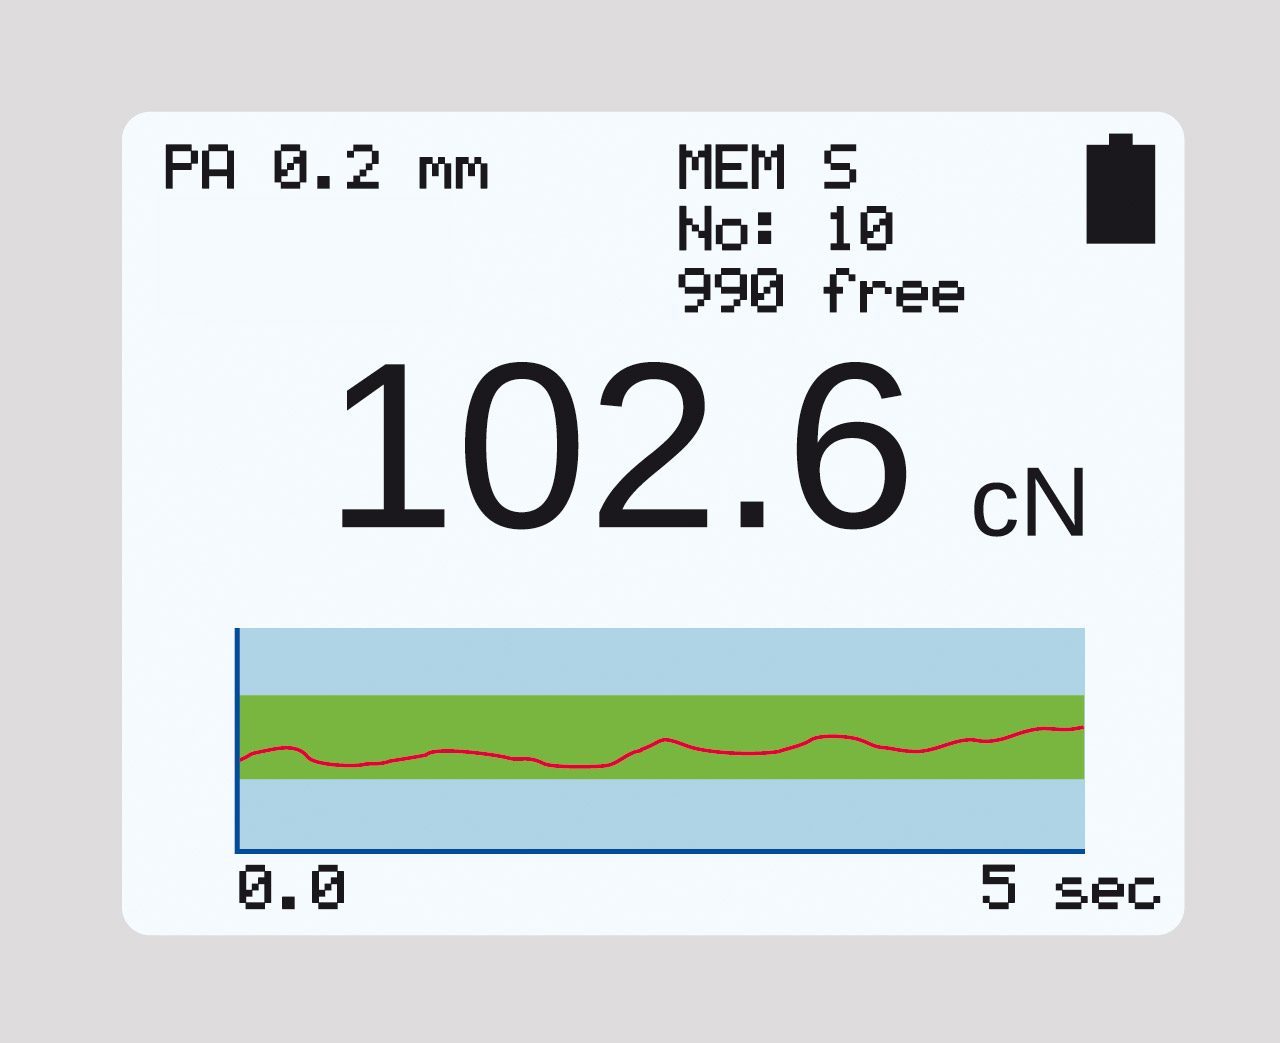
Tension meter MST has a coloured, backlight TFT display with 3 different display modes
– numeric
– numeric with live bargraph
– numeric with graph (time-tension)
– numeric
– numeric with live bargraph
– numeric with graph (time-tension)
The display rotates in 90° steps for better reading
Tension meter MTS can be connected to a PC using the USB interface to monitor readings constantly on a PC
Memory for 60.000 readings
5 different memory modes can be selected by the operator:
- Mode S: only statistical values per series are displayed
- Mode H: storage of the X-Y-diagram for reviewing after finishing a series of measurement
- Mode C: continuous logging over a user set time and max. 999 series of measurement (2 Hz)
- Mode F: as C with higher sampling rate (200 Hz)
- Mode D: storage of single readings and statistic
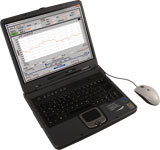 Model MTS can be connected to a PC with the USB cable. With the software SW-TI3-M »Tension Inspect 3« readings can be displayed, statistically analysed and saved. For more information see “Optional Accessories”[/rt_icon_list_line]
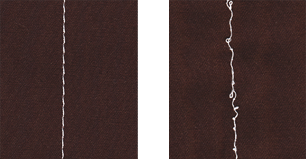
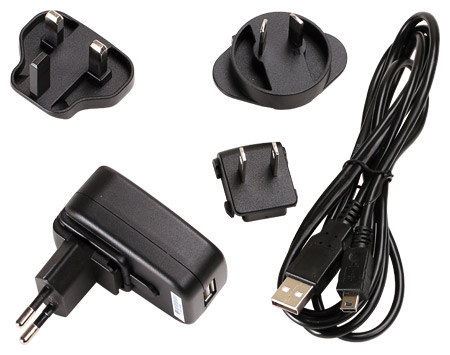 USB AC adapter with 4 adapters (EU/USA/UK/AUS-NZ) for 100 – 240 V AC and USB cable for loading the accumulator (serial no. 306-0001 and higher).
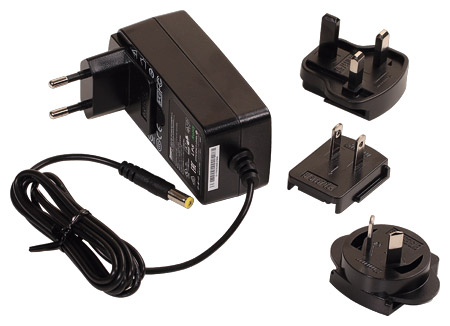 AC adapter with 4 adapters (EU/USA/UK/AUS-NZ) for 100 – 240 V AC for loading the accumulator (up to serial no. 305-9999).
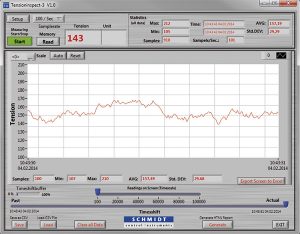
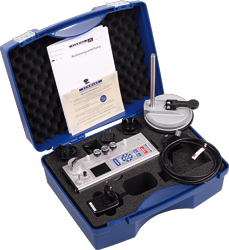 Tension meter MST with carrying case, vacuum base, Li-Ion battery, USB AC-Adapter with 4 adapters (EU/USA/UK/AUS-NZL) and operating instruction in German or English (as requested)